Google Trends is an incredibly useful, free tool for marketeers. Whether you are a full time SEO or just want insights into the way people search, it’s a great tool to understand and be able to use.
This guide looks at how to use Google Trends. It’s a relatively straightforward tool to use, but knowing a bit more about will ensure you get the most out of it.
How to look up search data on Google Trends
Head over to Google Trends and you’ll find the home screen will look something like this:
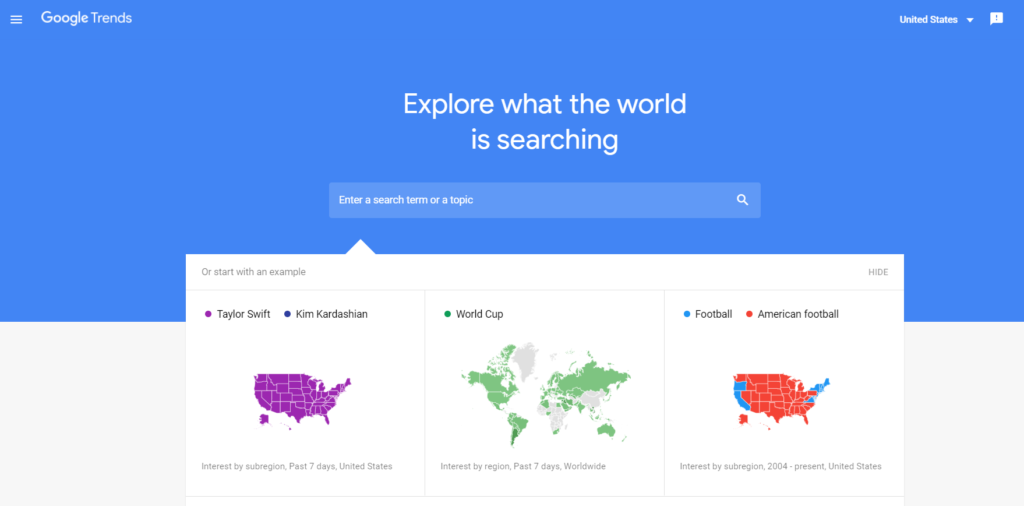
Below the search bar you’ll find a few examples of search trends you can look at. And below these there are other cool insights and data summaries including the ‘Year in Search’.
For now, let’s focus on entering a search term in the bar at the top of the page to get started. For this guide, we’ll go with the simple example of ‘apples’:
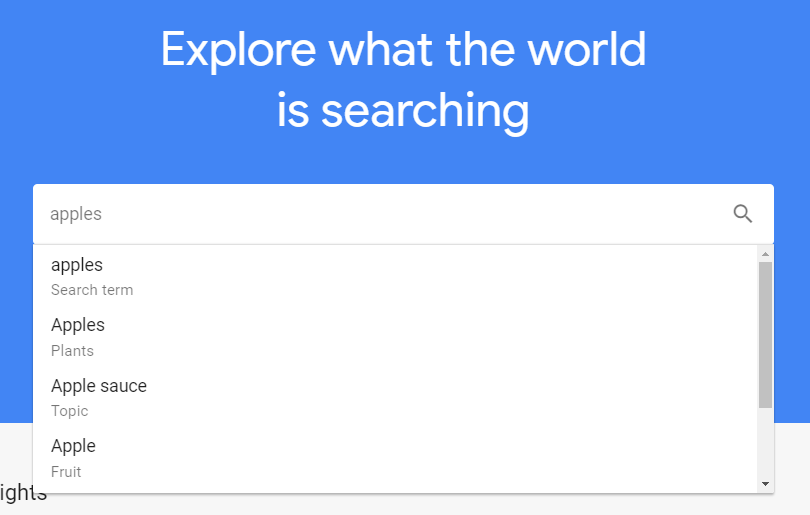
You’ll notice there are a few options (‘Search term’, ‘Plants’, ‘Topic’ etc.). Google explains the difference between topics and search terms here, and the selection you pick will depend on what it is you’re most interested in.
It’s important to note that none of the options allow you to just see the exact search trend for the keyword ‘apples’. Even if you select ‘Search Term’, that will still include variants like ‘best apples’, so do bear this in mind when drawing conclusions from any of the data in Google Trends.
Viewing Google Trends Data
Once you’ve selected the keyword(s) you’re interested in and hit enter, it’s time to start viewing the search trends data, which will look like this:
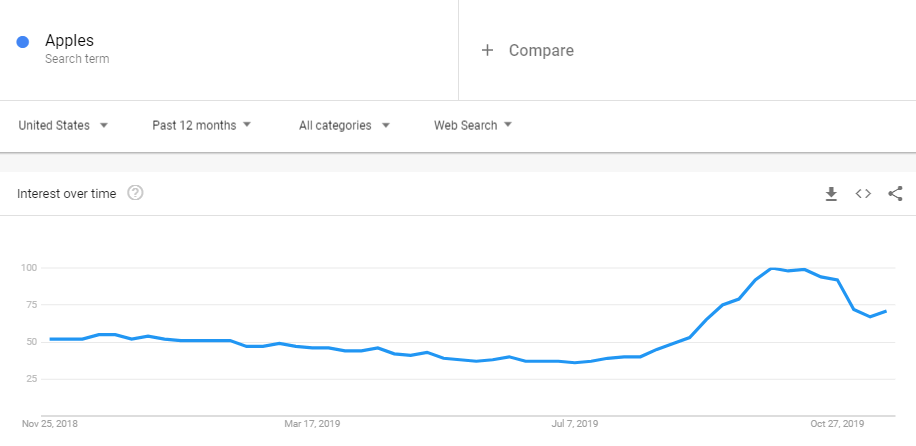
This is the search trend for ‘apples’ over the past 12 months. The data shows the past 12 months, running from November 25th 2018 to November 23rd 2019. It doesn’t include the 24th as Each data point represents a week from Sunday to Saturday (and this post is being written on a Saturday).
How to interpret Google Trends data
From the graph above, it’s fairly easy to understand that more searches take place around September and October, but what does the data on the Y axis in Google Trends actually mean?
The values on the Y axis represent ‘Search Interest’, and by clicking on the little question mark next to ‘Interest over time’, you can find out what this actually means:
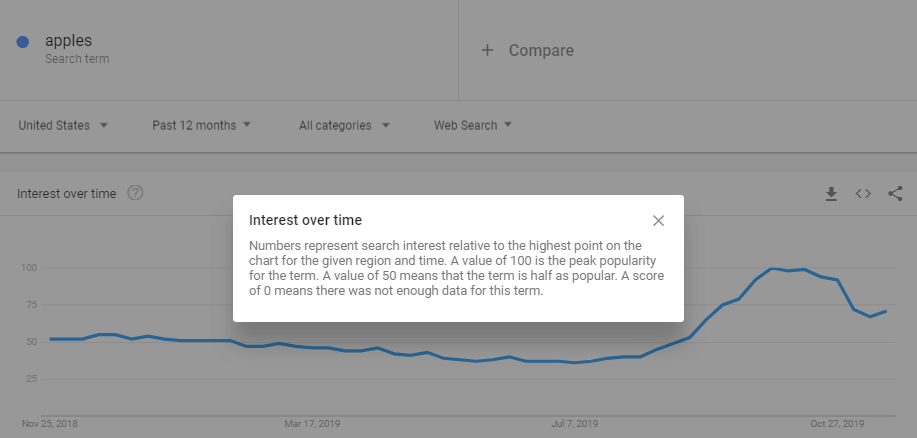
So the data in the Google Trends graphs shows search demand in relative terms, on a scale of 0 to 100. This means the data isn’t showing the actual search volume, and that depending on the date ranges you select, the numbers will vary for each data point depending on the relative search interest for each point.
How to view different time ranges for keywords in Google Trends
Looking at the past 12 months’ search interest for different keywords is interesting, but what’s more interesting is looking at longer time ranges and to see year on year trends. You can do this by clicking on the ‘Past 12 months’ option and selecting a different time range.
There’s a range of options to choose from e.g. past 30 days, past 5 years etc. and you can also select your own custom date range. In the image below, 2004 – present has been selected which is the longest date range you can view:
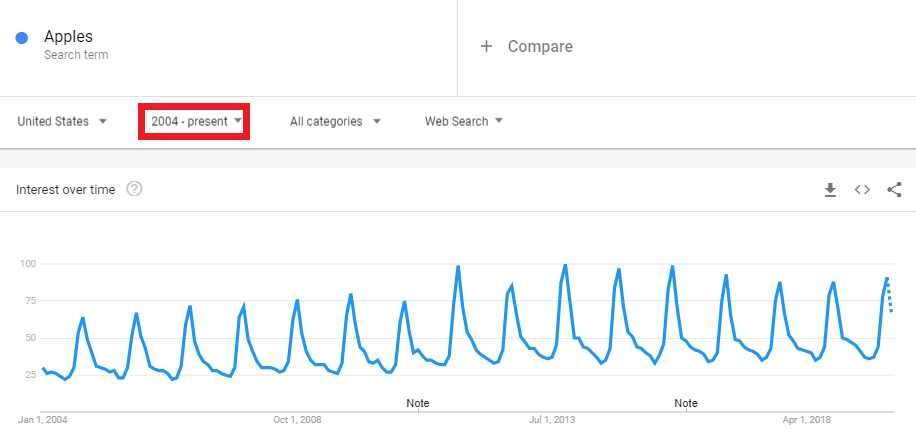
Viewing different time ranges can be very insightful. You might, for example, find that one of the reasons you’re experiencing lower traffic to your site compared to previous years is because searches for your brand name have been declining. On the other hand, you could also spot topics with an upward trend to help inform your content strategy.
How to compare search interest across different keywords on Google Trends
So far, we’ve just looked at the ‘apples’ keyword in Google Trends. But Google Trends is also really useful for visualising how search trends vary for different keywords/topics. For example, below we’ve compared apples with other fruits.
You can enter up to five different keywords/topics into Google Trends at the same time, and you do this by just clicking on the + Compare box and adding a new keyword.
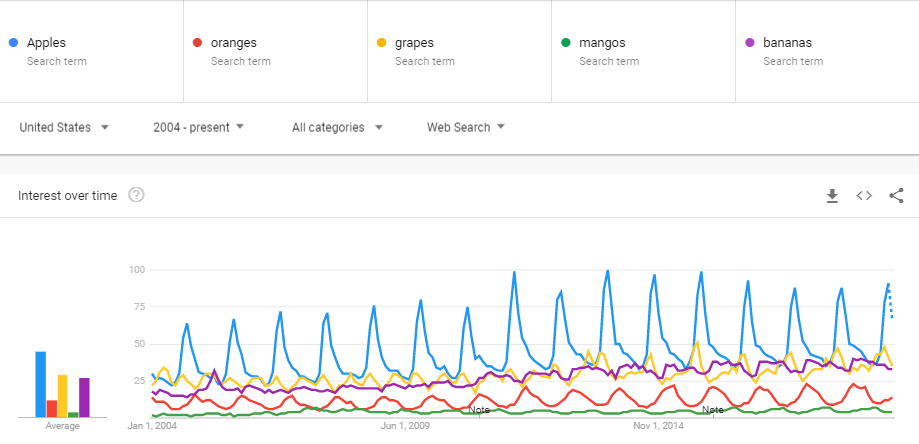
Along with the line graph showing how the seasonality and popularity of these fruits varies, you can also see the average comparison across the different keywords with the bar chart to the right – especially handy when it’s difficult to see a clear difference on the line graph.
How to view YouTube, Google Images, Google News, and Google Shopping search interest in Google Trends
The default setting in Google Trends is to view search interest data for Google web search, but you can also view search interest data for YouTube, Google Images, Google News, and Google Shopping. Just select the button below, and select from the drop down (here, we’ve selected YouTube):
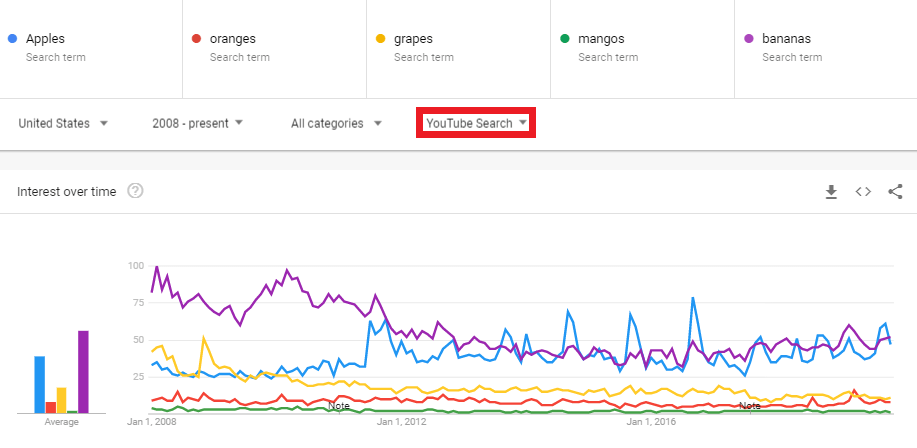
YouTube is the world’s second biggest search engine, and search trends aren’t always the same across Google web search and in YouTube, so it’s worth checking out how trends vary here if you’re looking to produce video content.
How to export, embed, and share data from Google Trends
Visualising search trends in Google Trends is great, but the tools also gives you the option to export it into CSV for further analysis in Excel, to embed the graph into your site, or to share it via social media. These actions can all be done with the options outlined below:

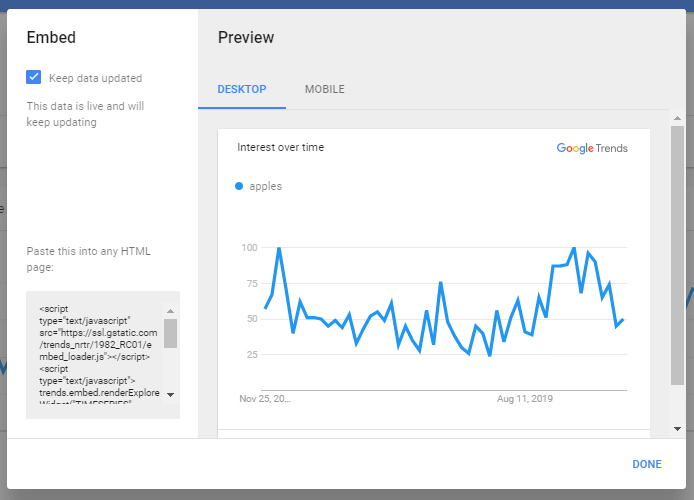
When you embed the data, you also have the option to copy the code that will keep the data updated rather than just taking a snapshot of how it appeared when you viewed it:
How to view regional search interest in Google Trends
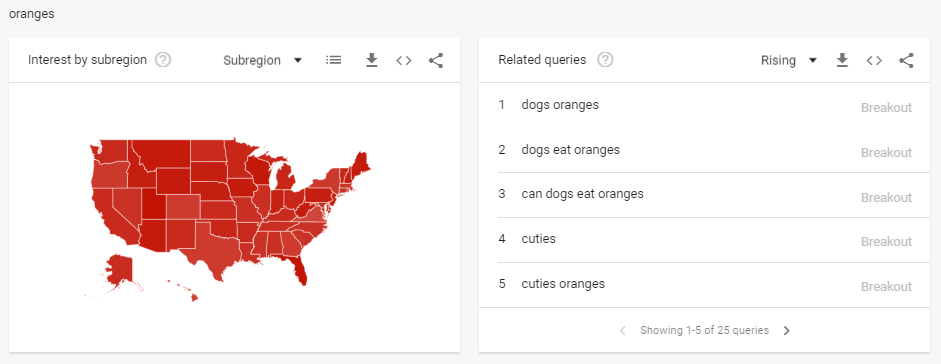
If you scroll down below the main line graph in Google Trends, you’ll find a range of other useful data. The first of these is the module showing search interest by subregion:
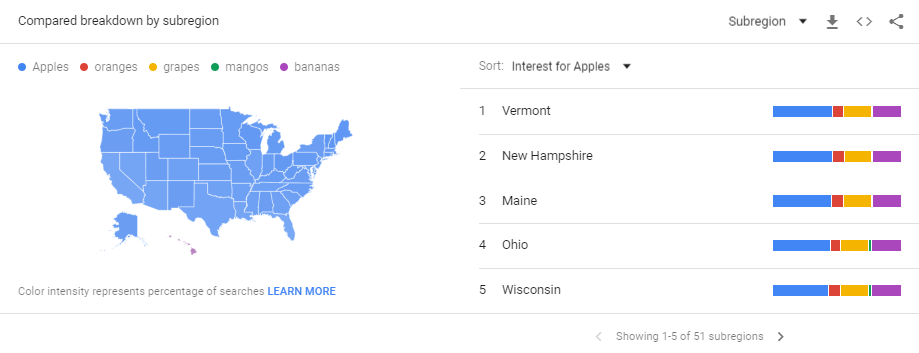
In this particular case, ‘Apples’ is the most popular of the keywords across all of the US, but you can see how the trends vary by state to the right of the map.
Viewing search popularity by region and related queries
If you continue scrolling, you’ll find each of our chosen keywords has their own module showing how the search interest varies by region, and popular related queries: